
"Fear is the main source of superstition and one of the main sources of cruelty. To conquer fear is the beginning of wisdom."
The end of a painful road...
How'd we get here?
1. Euphoric capital markets conditions:
With mortgage borrowing rates around 3% and favorable growth outlooks, commercial real estate values and transactions spiked.
2. Most aggressive rate-tightening in history:
The Fed has raised interest rates 11 times since March 2022.
3. Most aggressive reversal of Fed bond-buying in history:
After injecting trillions of dollars into the bond market (pushing down benchmark interest rates and mortgage rates), the Fed reversed course in 2022, leaving real estate markets reeling.
4. Pricing uncertainty / bid-ask gap / stalled transaction activity:
Lenders left first. Then buyers. Then sellers (holding onto yesterday's prices), unless events (e.g., loan maturity) forced a sell. Industry players stared at each other for 18-24 months.
5. Rebalancing from equity to debt:
Capital providers asked why they would invest in equity if they could get similar yields in debt. "Private credit" and "preferred equity" quickly became the most worn-out industry terms.
6. Fed stops the rate tightening cycle
The Fed began to signal in Nov/Dec 2023 that it may be done with its rate-tightening cycle.
---- So where does that leave CRE values? ----
It's probably fair to say that private real estate values have been in freefall over the last 18-24 months. Lenders are scared, buyers are worried about catching a falling knife, and sellers are inclined to kick the can. So cap rates have, in theory, skyrocketed.
Where do cap rates peak? Our best guess: Cap rates peak when values fall to levels that are attractive to value-oriented buyers with near-constant access to capital.
Enter REITs.
When properties stop selling, we're all guessing about where values are. E.g., one leading real estate index says values are down by 10%; the other says values are down by 25%.
But REITs are always trading, and since we know a lot about the properties that REITs hold, we can tie REIT share prices to property incomes, which provides indications of market yields.
---- Takeaways ----
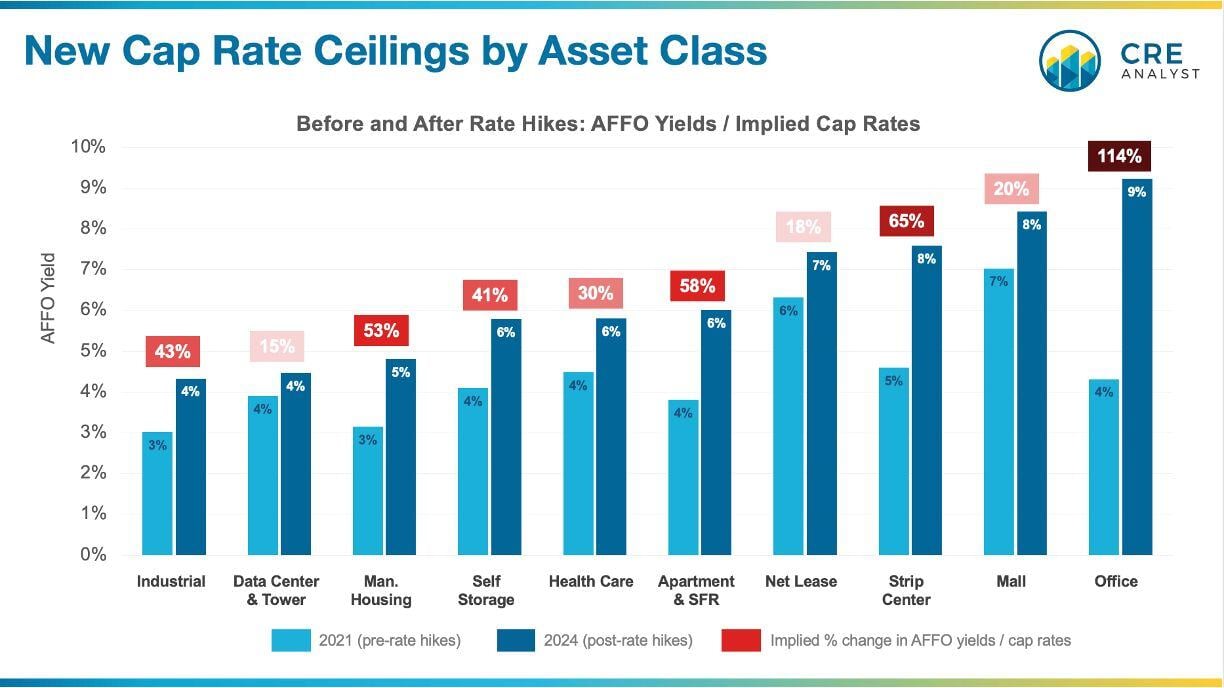
This chart shows...
1. Where we believe REITs could accretively buy properties before the Fed hiked rates
2. Where we believe REITs could accretively buy properties today (post rate hikes)
3. The implied value change (assuming no income change)
Note: The yields on this chart do not necessarily reflect where market cap rates are. They reflect where it would make sense for REITs to step in to buy properties, which would then be the market cap rate. i.e., this is somewhat of a "worst case" for real estate pricing.
Why does this matter?
...because the CRE industry may finally have a cap rate ceiling (and a pricing floor) as we pivot into a period of more stable interest rates.
COMMENTS