
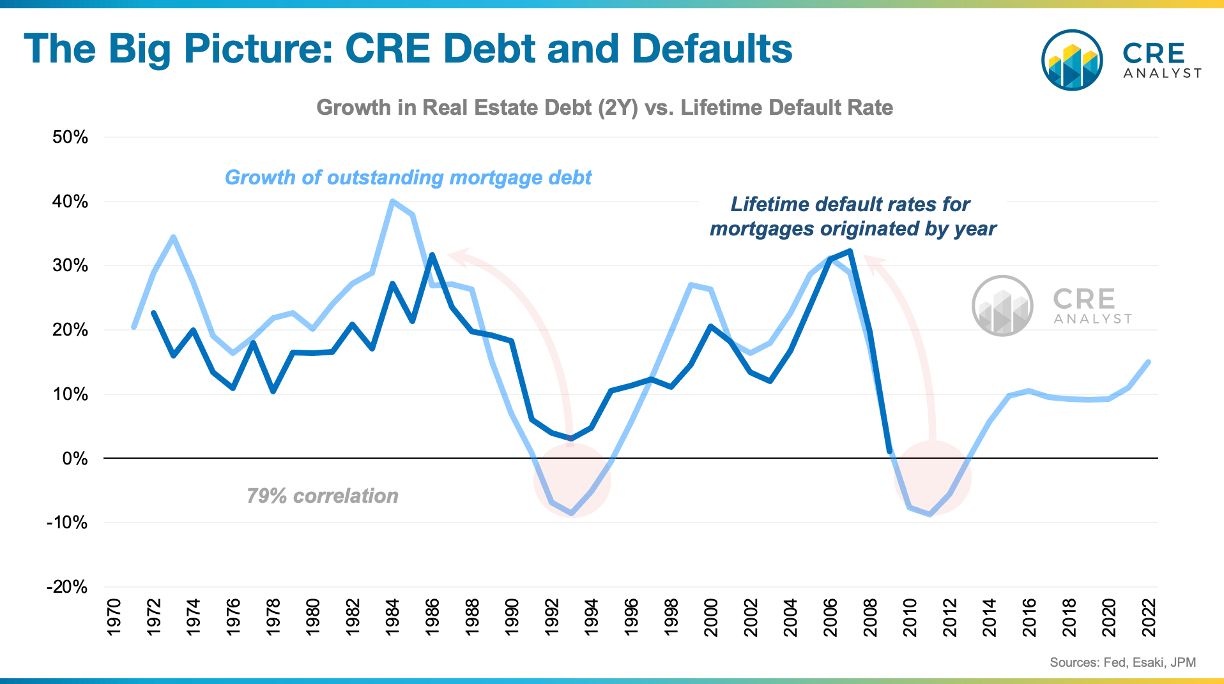
What do you see when you look at this chart? A CRE Rorschach test.
Is commercial real estate headed for a crash or is distress overhyped? The answer is almost certainly buried in this data.
These two datasets are (i) fundamental to the CRE industry, (ii) nearly 80% correlated, and (iii) rarely, if ever, discussed by industry pundits.
---- Quick background ----
-- Outstanding debt (light blue line): Growth of outstanding commercial and multifamily mortgages over trailing two years. Debt has grown historically by about 7% per year over the last 50 years.
-- Periods of deleveraging (light blue line below 0%): Notice the two historical periods when outstanding debt contracted. 1992-94 and 2010-12. Those periods were pivot points, which were followed by severe real estate distress.
-- Mortgage defaults (dark blue line): The lifetime default rate of mortgages originated by year. Defaults have averaged about 15% with meaningful differences between good and bad years. The worst years for originations were, unsurprisingly, at the peak of debt growth.
-- Debt peaks: There were pronounced runups in outstanding debt in the mid-1980s and early-2000s. Those periods both experienced 30%+ default rates and were followed by 6-8 years of slow debt production.
-- High correlation: These two measures (growth in outstanding debt and vintage default rates) are 79% correlated over nearly 40 years. This is the highest correlation between any two substantive datasets that we track.
---- Key takeaways ----
Good news...
-- No big runup in overall real estate debt, although some segments bucked the trend (debt funds, CRE CLOs; more to come on both of these segments in future posts).
-- Default rates remain very low. We don't have vintage default rates for recent vintages, but delinquency indicators are favorable for about 80% of the CRE debt market (banks, insurance companies, agencies).
Bad news...
-- Debt production is down. Lenders "kicking the can" on maturities doesn't force deleveraging. But requiring payoffs does. When collateral fails to support a refinance and/or lenders refuse to provide debt at all, the amount of outstanding debt falls, and mortgage defaults spike.
So what do you see when you look at this chart? A healthy balance or a hard landing ahead for CRE?
COMMENTS