
A new world: 10 stats defining the U.S. housing market
---- Delayed ownership ----
1. First-time homebuyer age today: 38
2. First-time homebuyer age 40 years ago: 29
[Today's buyers spend 82% longer renting as adults after turning 18.]
---- Changing households ----
3. "Nuclear family" households (parents + kids): 30%
4. Households consisting of individuals living alone: 20%
---- Longer lives, more housing needs ----
5. Life expectancy for a 20-year-old today: about 80
6. Life expectancy for a 20-year-old 40 years ago: about 73
[That’s roughly 50% more years spent as an empty nester if downsizing occurs at age 60.]
---- Homes as a piggy bank: Then vs. now ----
7. Profit from buying a home 10 years ago: approximately $192K (4.8x original equity)
8. Projected profit if you buy today (and hold for the next 10 years): about $177K (1.7x original equity)
---- Affordability shifts ----
9. Typical downpayment 10 years ago: $33K
10. Typical downpayment today: $65K
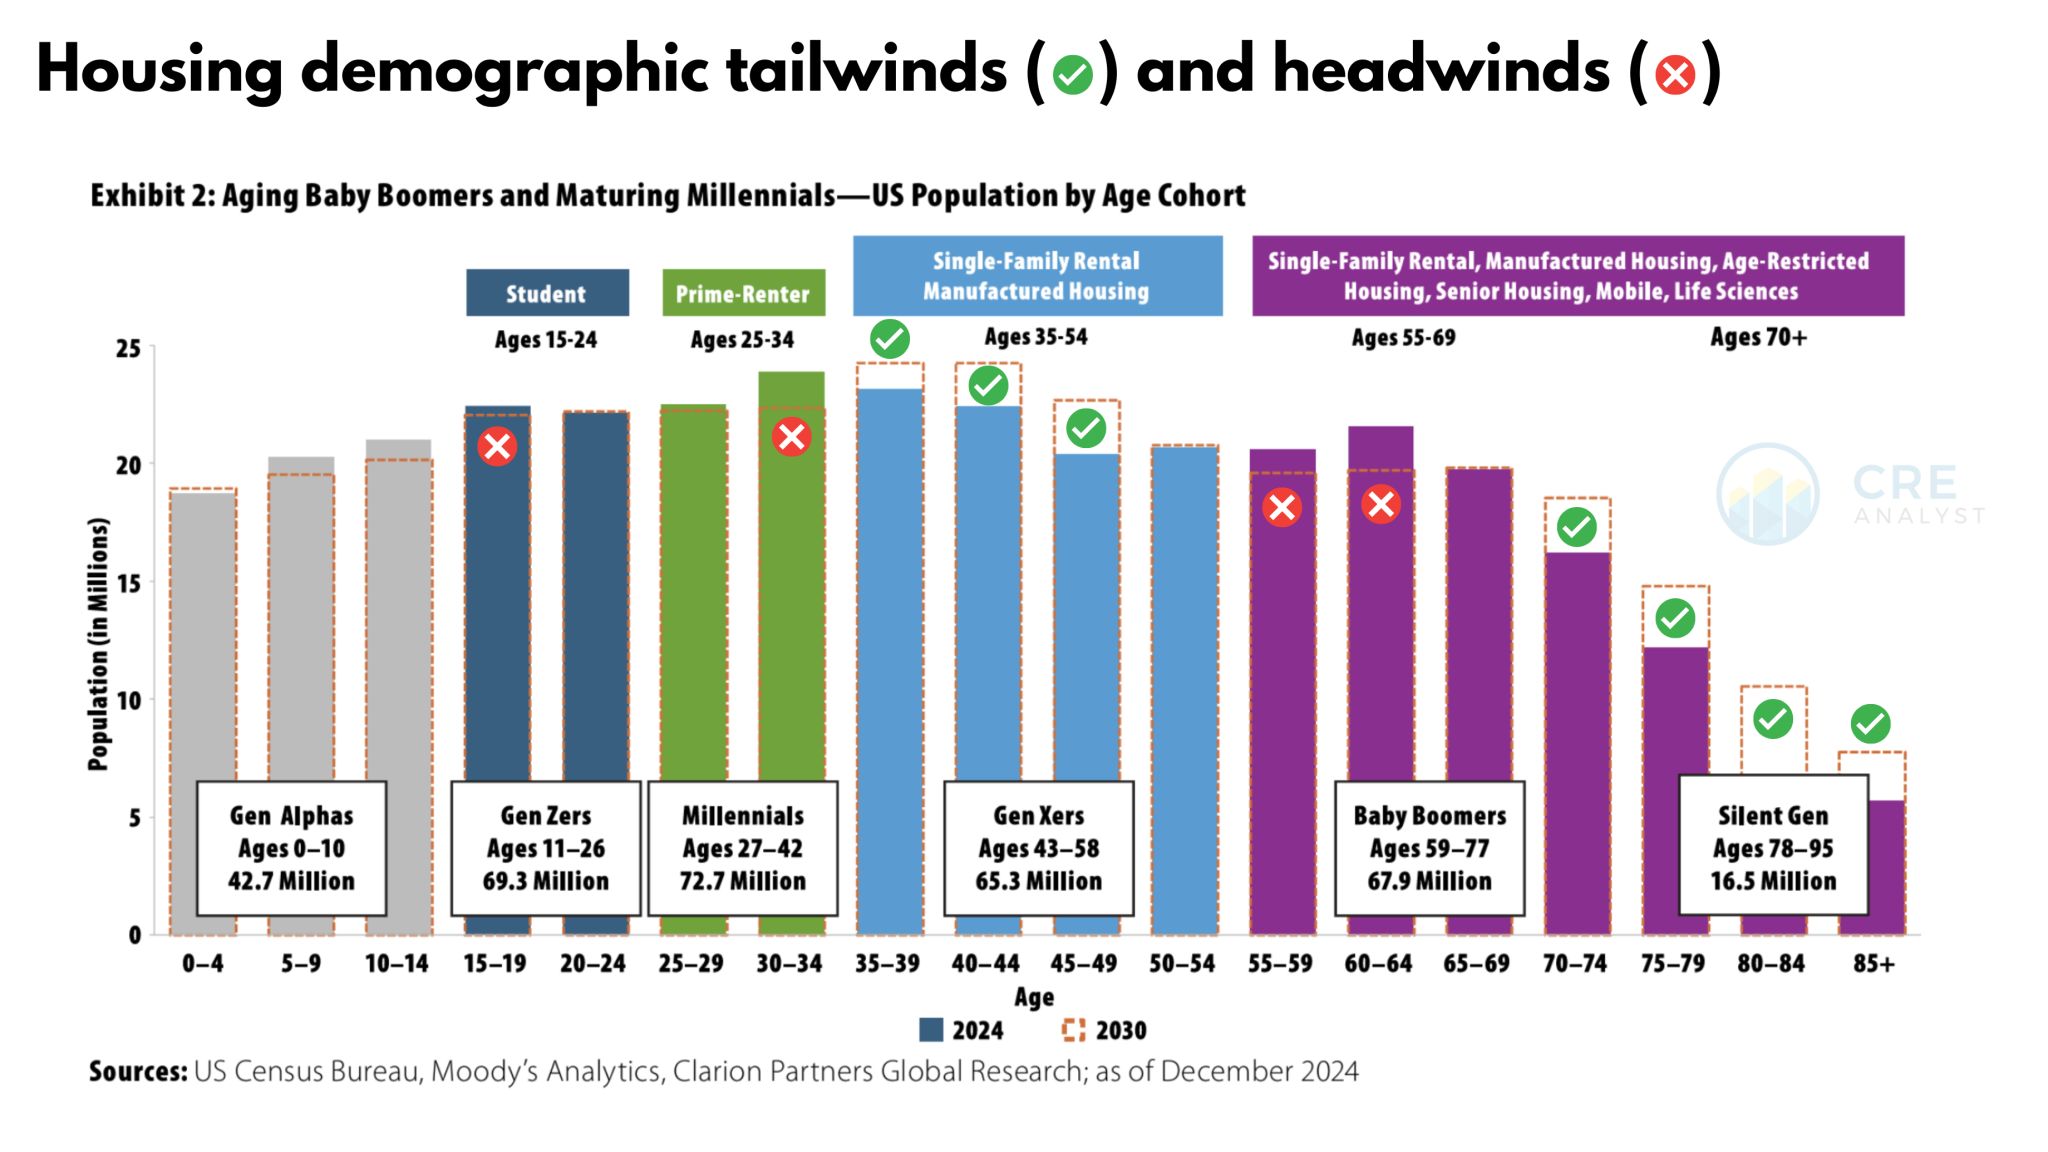
The housing market isn't monolithic. It's complex and differentiated.
The most critical factor shaping the market today (and tomorrow) is demand.
[How many people will need, and be able to afford, specific housing types?]
That’s why Clarion's recent analysis in the PREA Quarterly is so meaningful.
Investors back new supply attempting to anticipate future demand. For example, look at projected demand for single-family rentals and senior housing versus today's levels.
Bottom line: Demographics aren't just statistics; they’re your roadmap to understanding tomorrow’s housing market.
COMMENTS