
Where's the disconnect?
----- Construction spending -----
Construction spending as of July 2023 per the U.S. Census...
- Single-family construction is down 15.2%
- Multifamily construction is up 24.6%
- Lodging construction is up 20.9%
- Commercial construction is up 9.2%
- Office construction is up 2.3%
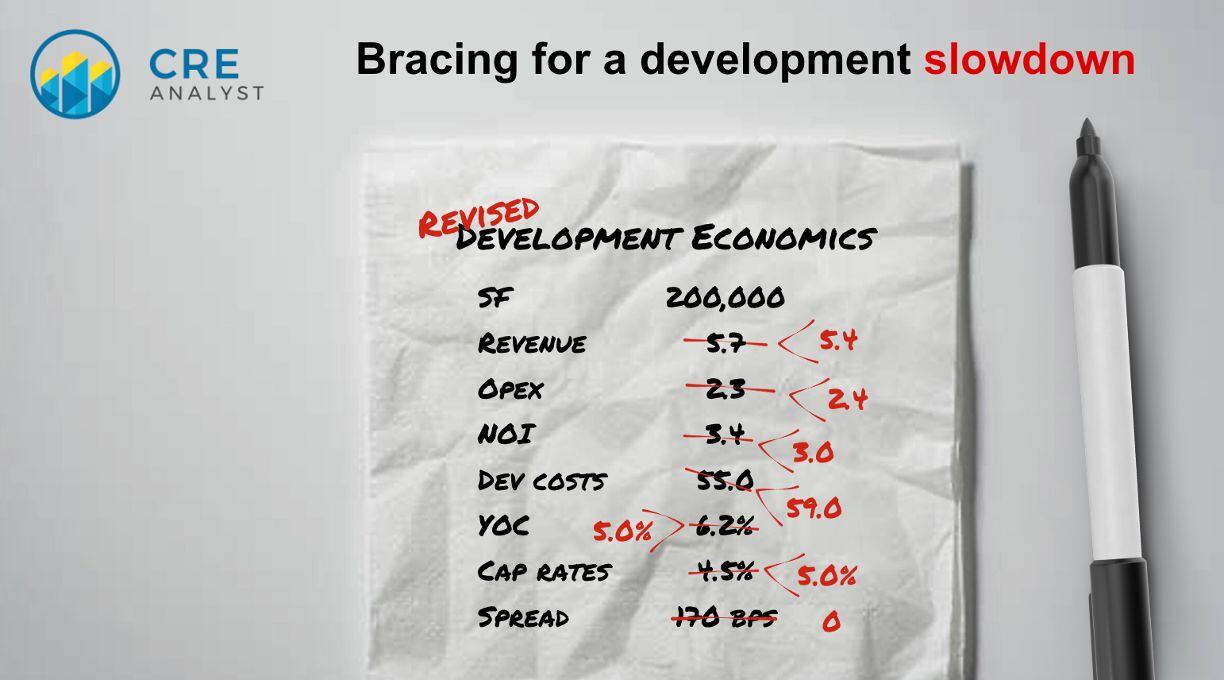
----- Our updated take on development economics -----
- Revenues are down due to flat rent growth (at best), higher vacancy, and higher credit loss.
- Operating expenses are up due to higher taxes and insurance and higher vacancy (for net leased properties).
- Development costs are up, primarily due to higher construction loan interest and higher rate hedges.
- Cap rates are up due to higher risk-free rates and lending spreads.
With virtually no spread between pro forma YOC development projects and projected exit cap rates, we should start to see a massive slowdown in new development. ...right?
----- Why the disconnect? -----
Why hasn't this very meaningful disconnect shown up in the Census data?
There seem to be only three possible explanations...
1. The Census data is inaccurate.
2. Our anecdotal approach is inaccurate.
3. They're both accurate, but the Census data hasn't flowed through the pipeline yet.
Our best guess: If the Census data is for value put in place at the end of a project, then there would be a 2-3 year lag from when development decisions were made and when development value was actually put into place.
...which would mean we should see a very significant slowdown in development projects that were planned when rates started spiking eighteen months ago and would have been completed in the next several months.
What do you think? Anyone have any insight into this?
COMMENTS