Zip codes with largest YoY home price declines...
Austin-Round Rock-Georgetown, TX [78660]: -4.05%
San Antonio-New Braunfels, TX [78130]: -3.92%
San Antonio-New Braunfels, TX [78245]: -2.97%
Austin-Round Rock-Georgetown, TX [78613]: -2.23%
Dallas-Fort Worth-Arlington, TX [75052]: -1.68%
Dallas-Fort Worth-Arlington, TX [75217]: -1.59%
New York-Newark-Jersey City, NY-NJ-PA [11233]: -1.52%
New York-Newark-Jersey City, NY-NJ-PA [10025]: -1.47%
Houston-The Woodlands-Sugar Land, TX [77449]: -1.11%
Urban Honolulu, HI [96706]: -1.08%
Of the largest 100 markets, Texas zip codes account for 7 of the worst 10 performing zip codes.
The strongest 10 zip codes?
New York-Newark-Jersey City, NY-NJ-PA [10458]: 12.79%
New York-Newark-Jersey City, NY-NJ-PA [8701]: 9.75%
San Jose-Sunnyvale-Santa Clara, CA [95035]: 9.06%
Chicago-Naperville-Elgin, IL-IN-WI [60629]: 8.04%
New York-Newark-Jersey City, NY-NJ-PA [11230]: 7.69%
Los Angeles-Long Beach-Anaheim, CA [92683]: 7.49%C
hicago-Naperville-Elgin, IL-IN-WI [60804]: 6.69%
Chicago-Naperville-Elgin, IL-IN-WI [60632]: 6.57%
Los Angeles-Long Beach-Anaheim, CA [92804]: 6.48%
New York-Newark-Jersey City, NY-NJ-PA [11204]: 6.02%
Lots of NYC and midwestern zip codes on this list.
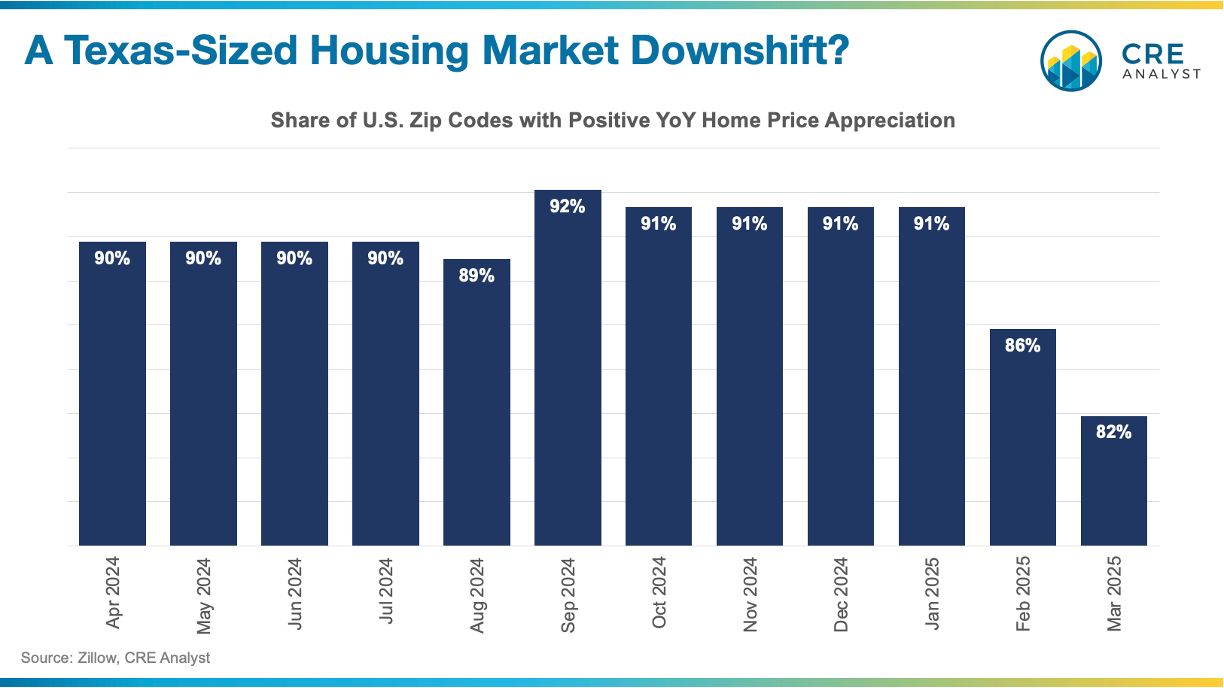
The share of zip codes with declining home prices has roughly doubled in the last three months (as of March).
It'll be interesting to track both of these concepts over the coming months: 1) share of markets with YoY declines and 2) will the sunbelt star markets lead the broader market down?

COMMENTS